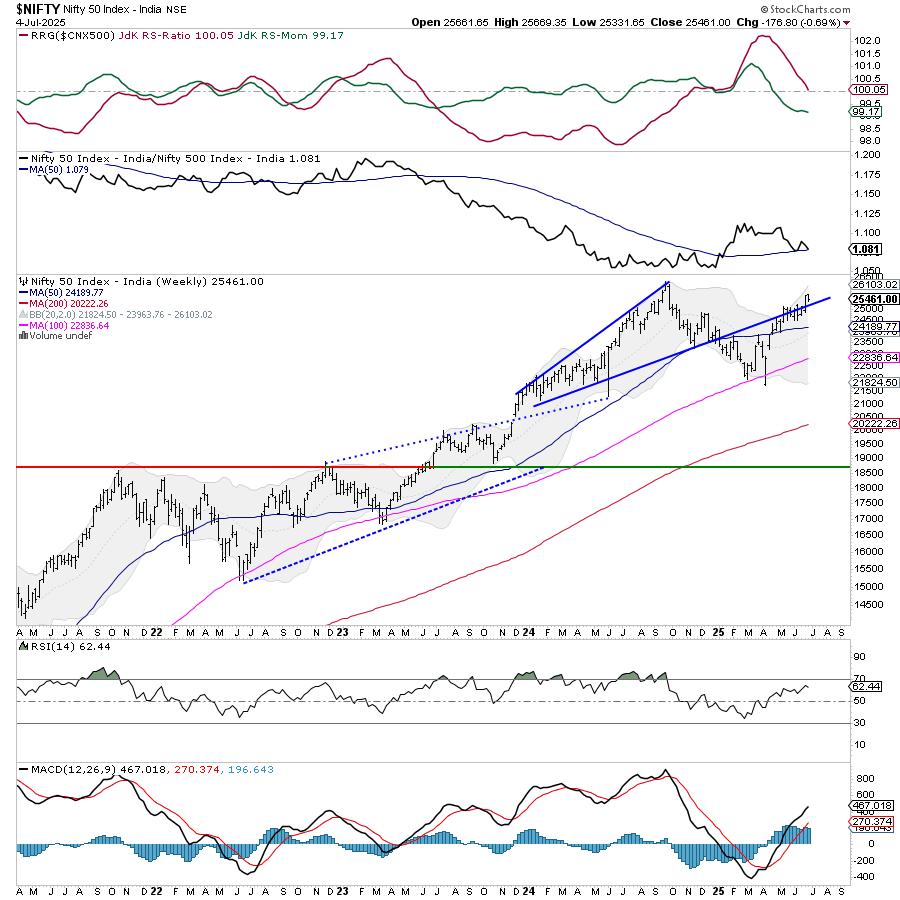
After a strong move in the week before this one, the Nifty spent the last five sessions largely consolidating in a very defined range. The markets traded with a weak underlying bias and lost ground gradually over the past few days; however, the drawdown remained quite measured and within the expected range. As the markets consolidated, the trading range got narrower. The Nifty moved in a 337-point range during the week. While the Index formed a near-similar high, it marked a much higher low. The volatility also retraced; the India VIX came off by 0.59% to 12.31. While showing no intention to trend higher, the headline Index closed with a net weekly loss of 176.80 points (-0.69%).
The Nifty has created an intermediate resistance zone between 25600 and 25650. A trending move on the upside would happen only if the Nifty is able to take out this zone on the upside convincingly. Until that happens, we will see the Nifty continuing to consolidate with 25100 acting as support. This is the prior resistance level, which is expected to act as support in case of any corrective retracement. So long as the Nifty is inside the 25000-25650 zone, it is unlikely to develop any sustainable directional bias on either side.
Friday was a trading holiday in the US. Because of this, we will not have any overnight cues to deal with on Monday. The Indian markets may see a stable and quiet start. The levels of 25650 and 25800 are likely to act as probable resistance points. Support levels come in at 25250 and 25000.
The weekly MACD is bullish and remains above its signal line. The weekly RSI is 62.40; it stays neutral and does not show any divergence against the price. No major formation was noticed on the candles.
The pattern analysis of the weekly chart reveals that after breaking above the rising trendline resistance and moving past the 25000-25150 zone, the Nifty consolidated after trending higher for four consecutive days. Over the past week, it gave up a portion of its gains and consolidated at higher levels. In the process, it has dragged its support level higher to 25000. As long as the Index remains above this point, the breakout and the resumption of the upmove observed in the preceding week remain valid and intact.
Overall, it is expected that the Nifty will remain within the 25000-25650 range over the coming week. The markets are unlikely to develop any directional bias unless they move past the 25650 level or violate the 25000 level. Sector rotation within the market is very much visible; it would be imperative to efficiently rotate sectors and stay invested in those that show improved relative strength and a promising technical setup. We are likely to see improved performance in the Auto, Energy, IT, and broader markets, among other sectors. It is also strongly recommended to protect profits here, where the stocks have run up hard. Any aggressive shorting should be avoided as long as the Nifty stays above the 25000 level. A cautiously positive approach is advised for the coming week.
Sector Analysis for the coming week
In our look at Relative Rotation Graphs®, we compared various sectors against the CNX500 (NIFTY 500 Index), representing over 95% of the free-float market cap of all the listed stocks.
Relative Rotation Graphs (RRG) show that the Nifty PSU Bank Index and the Midcap 100 Index are the only two groups that are inside the leading quadrant. They are likely to outperform the broader markets relatively.
The Nifty Infrastructure Index is experiencing an improvement in its relative momentum while it remains within the weakening quadrant. Additionally, the PSE, Nifty Bank, and the Financial Services Index are located within the weakening quadrant. While individual stock-specific performance may not be ruled out, the overall relative performance may take a backseat.
The Commodities Index and the Services Sector Index have rolled into the lagging quadrant. The Consumption, Pharma, and the FMCG Indices also continue to languish inside the lagging quadrant. The Metal Index is showing a sharp improvement in its relative momentum against the broader markets, while staying within the lagging quadrant.
The IT, Energy, Media, Realty, and Auto Indices are inside the Improving quadrant. They continue to rotate firmly while improving their relative performance against the broader Nifty 500 Index.
Important Note: RRG™ charts show the relative strength and momentum of a group of stocks. In the above Chart, they show relative performance against NIFTY500 Index (Broader Markets) and should not be used directly as buy or sell signals.
Milan Vaishnav, CMT, MSTA
Consulting Technical Analyst
www.EquityResearch.asia | www.ChartWizard.ae

